A question of numbers
In 2011 the Franciacorta Consortium became the first winemaking sector body to provide specific data gathered by its member producers via the Economic Observatory, a data surveying and statistical analysis system regarding Franciacorta sales and distribution in Italy and around the world.
The system covered 83.4% of member firms in December 2025 and is based on data gathered in anonymous form, giving its members access to ongoing statistical information on sales and marketing helping them to identify business strategies and compare company and sector-wide trends.
Access to Economic Observatory data is also a strategic asset where consortium investment allocation is concerned as well as helping the consortium develop targeted Franciacorta brand promotion strategies.
Franciacorta in figures
Sales volume — 2025
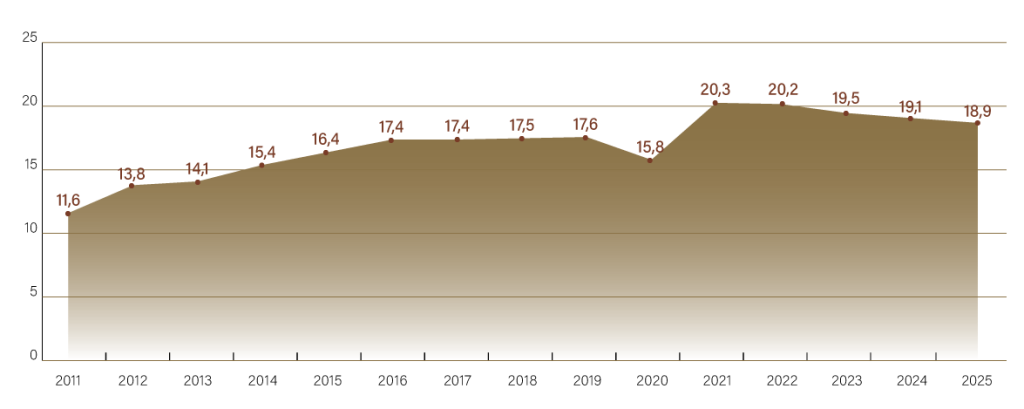
(Estimated against company totals; sample of firms taking part in the economic observatory: 83.4%)
Sales volume Italy/Abroad — 2025
◉ Estero
◉ Italia
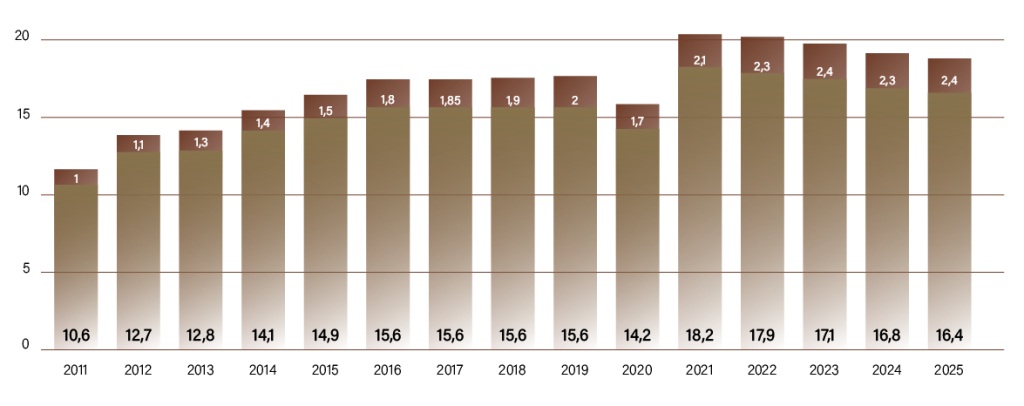
(Estimated against company totals; sample of firms taking part in the economic observatory: 83.4%)
Exports — 2025
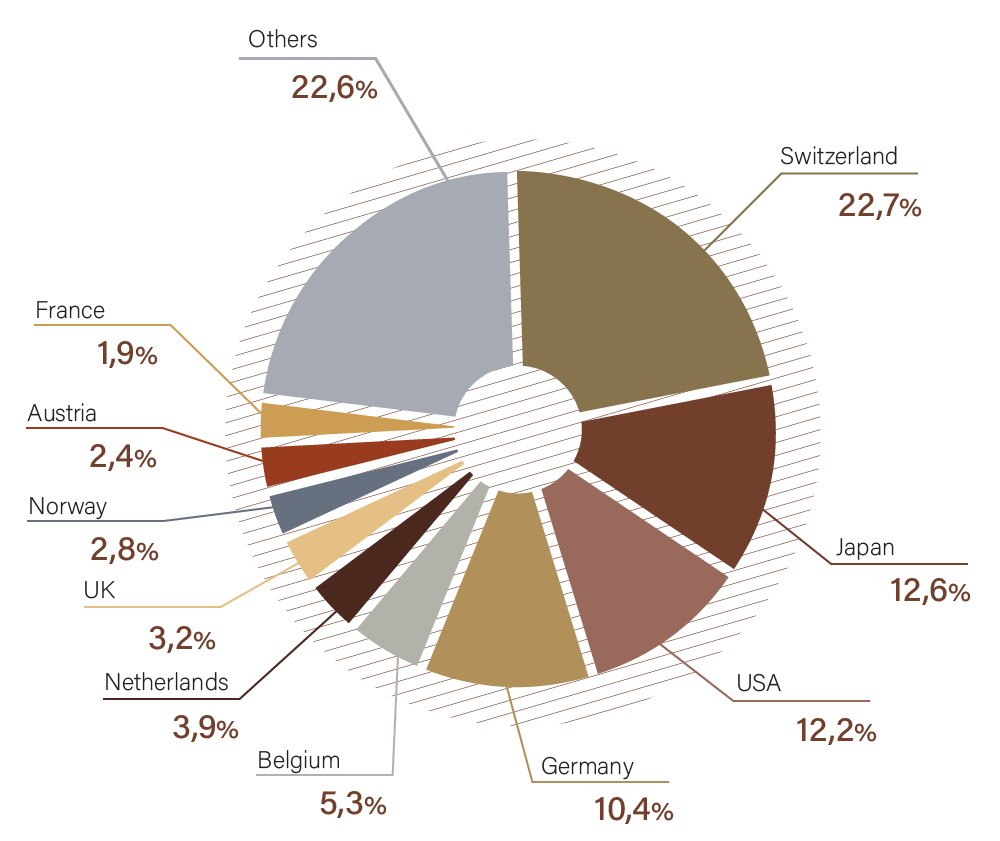
(Volumes estimated against company totals; sample of firms taking part in the economic observatory: 83.4%)
Sales volume by type — 2025
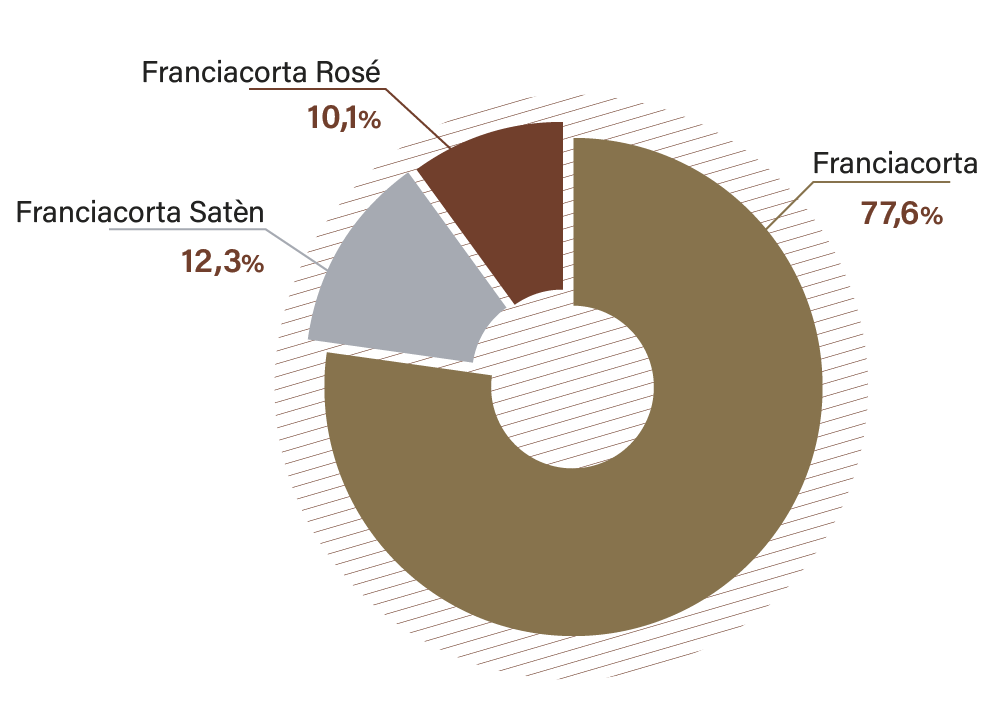
(Volumes estimated against company totals; sample of firms taking part in the economic observatory: 83.4%)
Data analysis 2025
Reference period: January–December 2025
Estimated coverage of member companies as of 31/12/2025: 83.4%
Methodological Note
The data presented in this document represent an estimate of the total for wineries that are members of the Consortium. This estimate is calculated using data from companies participating in the Economic Observatory. Considering this sample to be representative, for each year the coverage of participating companies is taken into account (for example, 82.4% for 2023 and 83.4% for 2025), and all related data are proportionally extrapolated to 100%.
For this reason, the data reported in this commentary differ from those shown in the report tables, which instead contain the exact (non-estimated) figures derived from companies’ monthly submissions.
Some data in this document may slightly differ from those communicated over the years, as minor corrections or data integrations may have occurred over time.
Summary of the Previous Year (2024)
Overall, 2024 recorded estimated total sales volumes of 19,128,814 equivalent bottles, showing a slight decrease compared to 2023 (-2.0%).
To fully understand the trend, it was useful to adopt a broader time perspective, which shows growth compared to the years immediately preceding 2023. Compared to 2019, the pre-pandemic year, 2024 sales were significantly higher (+8.9% in volume).
Alongside the slight decline in volumes, revenue performance was more positive (-1.4% vs. 2023; +24.8% vs. 2019), demonstrating a steady increase in the average selling price (+0.7% vs. 2023; +14.6% vs. 2019).
More specifically, the domestic market accounted for 88.0% of total sales volume in 2024, down 1.9% compared to 2023 (+8.1% vs. 2019). Exports represented the remaining 12.0%, with a variation rate of -3.1% compared to 2023 (+15.4% vs. 2019).
At the end of 2024, it was noted that sales data should be interpreted considering certain exogenous factors that likely negatively affected sales, primarily economic, political, social, and climate-related factors that characterized the year and continue to influence 2025.
Year 2025
The previously mentioned factors, together with the persistence of an uncertain geopolitical context—particularly affecting export dynamics—continued to exert their effects throughout 2025. As of the end of December, the year closed with sales volumes slightly below those of 2024, outlining an overall stable scenario, albeit with a slight quantitative contraction.
In this context, it is reassuring to consider overall revenue performance, which was broadly aligned with volumes. This dynamic confirms the strength of the Franciacorta brand and the resilience of the average selling price, which remains stable without showing signs of reduction, demonstrating continued market appreciation of the product.
More specifically, 2025 was characterized by an overall irregular trend during the year. After an initial contraction in the early months, followed by a partial recovery in spring, the market showed discontinuous dynamics in the central part of the year as well. The third quarter confirmed this volatility, alternating between growth and decline. The year closed with a strong rebound in December, which made a significant contribution to the overall result, mitigating the challenges that emerged during the year.
Overall, 2025 closed with estimated total sales volumes of 18,932,034 equivalent bottles, slightly down compared to 2024 (-1.0%).
Revenues decreased by -1.3%, while average prices remained broadly stable (-0.3%).
Compared to 2019, 2025 shows +7.8% in volumes, +23.2% in revenues, and +14.3% in average prices.
In 2025, the domestic market accounted for 87.2% of total sales volumes, down 1.9% compared to 2024. Exports represented the remaining 12.8%, with a growth rate of +5.3%.
Among sales channels, wine shops and direct sales recorded more significant declines, while large-scale retail (GDO) and the HoReCa channel showed better performance.
The distribution of domestic sales by Nielsen Area shows that the North-West regions account for 46.7% of domestic revenue, followed by Central Italy (21.0%), the North-East (20.5%), and the South (11.8%).
Lombardy remains the leading region (35.0% of sales in Italy), followed by Emilia-Romagna (9.5%). Lazio ranks third, tied with Veneto, each accounting for 8.7% of total sales.
Export Analysis
Switzerland confirms its leading position, representing 22.7% of total exports, up 8.4% compared to 2024 (+50.5% vs. 2019).
It is followed by Japan (12.6% of total exports; +22.4% vs. 2024; -14.0% vs. 2019), the United States (12.2%; +1.7% vs. 2024; +23.3% vs. 2019), Germany (10.4%; +1.6% vs. 2024; +0.1% vs. 2019), and Belgium (5.3%; +15.4% vs. 2024; +30.0% vs. 2019).
Other countries showing notable growth include the Netherlands (+37.7% vs. 2024), Spain (+25.2%), and the Czech Republic (+15.7%).
Globally, the average price per equivalent bottle stood at €15.34 at the end of 2024 and €24.45 at the end of 2025.
Concluding Summary Considerations
The 2025 closing data provide an overall picture consistent with the dynamics observed throughout the year, within a still complex and uncertain market environment.
The year closed with a slight decline in volumes compared to 2024 (-1.0%), accompanied by revenue trends broadly aligned (-1.3%) and substantial stability in average prices (-0.3%), confirming the strength of Franciacorta’s positioning.
In a context marked by cautious consumption and high market volatility, the Franciacorta brand has demonstrated solid resilience, supported by stable product value and sustained demand that continues to recognize its quality and identity.
While the domestic market declined (-1.9%), exports grew (+5.3%), confirming their strategic role in supporting overall sales balance.
Overall, 2025 closes with signs of balance and stability in a challenging environment, with a broadly positive comparison to the pre-pandemic period.